A behind-the-scenes look at a data analysis project at eRuchi, where we put our recommendation engine to the test in real-world conditions.
The challenge
Our team needed to validate whether the recommendation system I architected could deliver measurable value in actual usage. The algorithm uses a pairwise interest-similarity scoring approach designed specifically for eRuchi’s needs.
The goal: show that our tech can match users to what they care about, not just in theory but in practice.
The experiment
We ran a controlled study:
- Experiment group: received personalised recommendations from our engine
- Control group: received random suggestions
We tracked genuine user responses to these recommendations across several days.
What we found
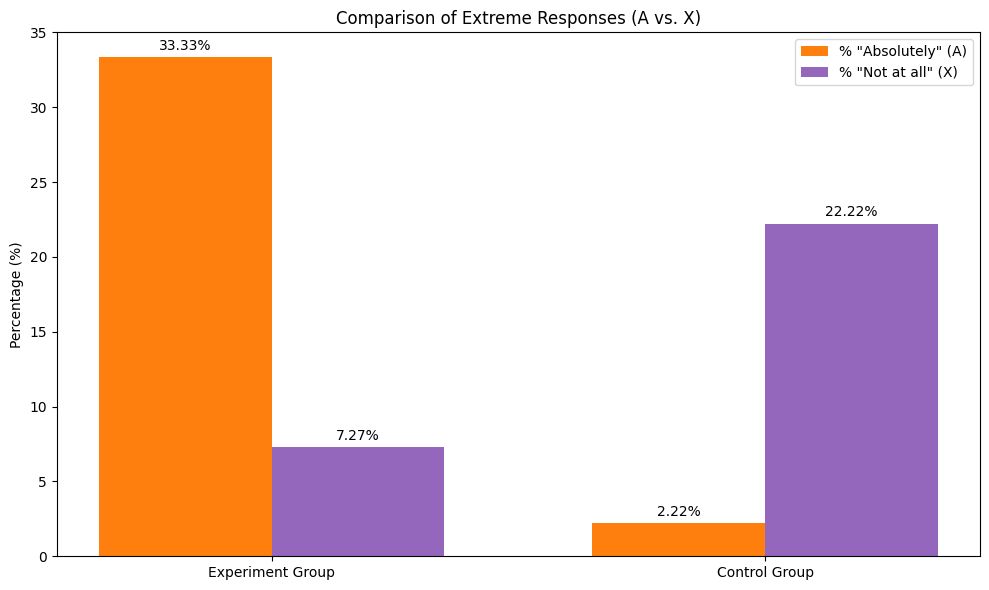
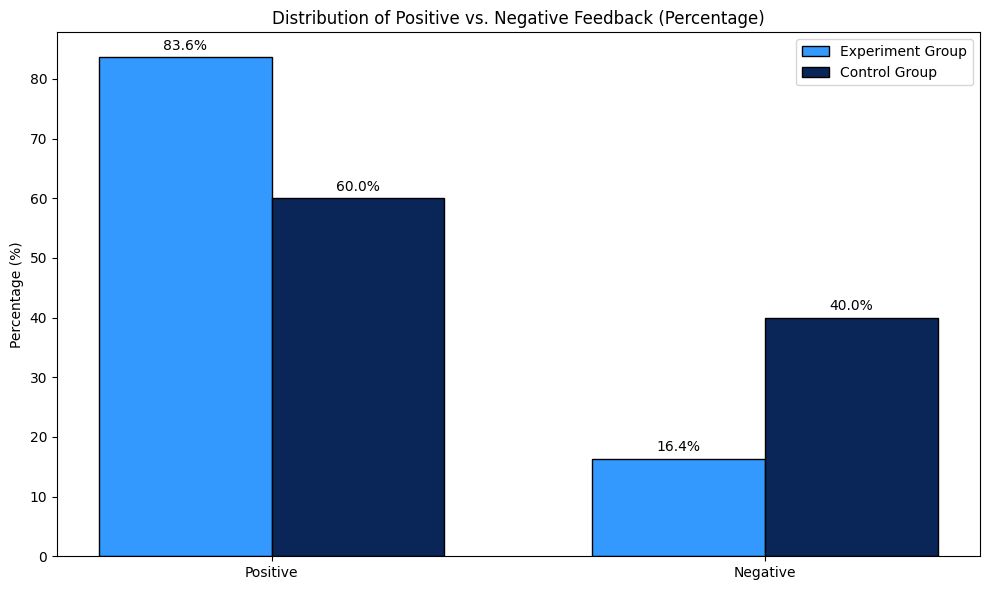
- A big boost in positive engagement. The experiment group was much more likely to say “Absolutely interested” to our suggestions.
- Fewer negative reactions. Strong negative responses (“Not at all interested”) decreased substantially.
Statistical confidence
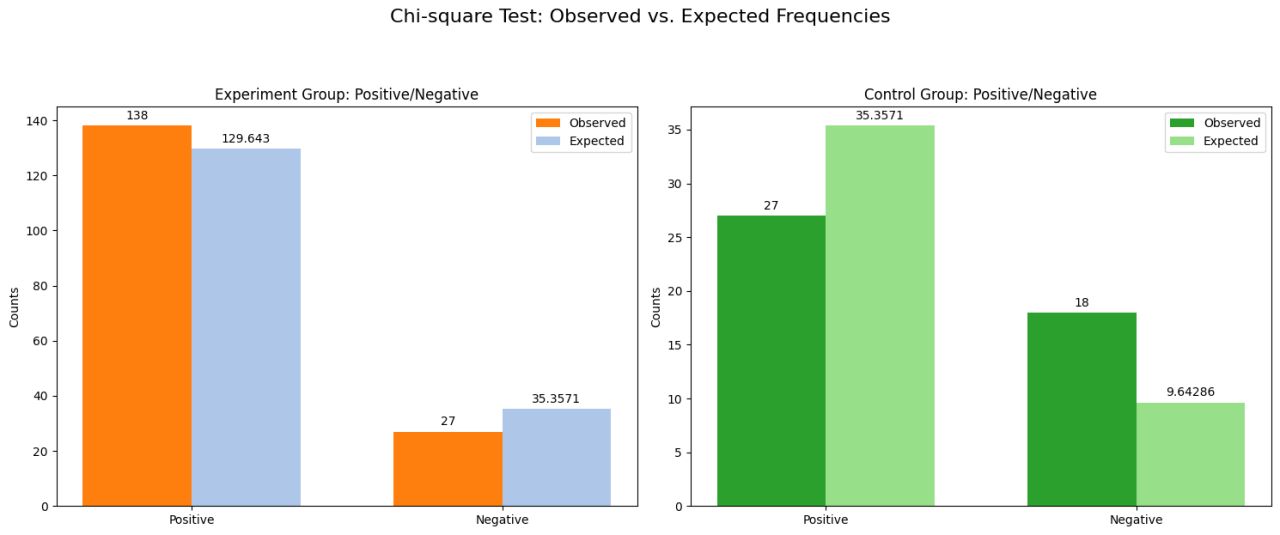
- p-value: 0.0013, a highly significant result
- Cohen’s d: 0.82, a large effect size
Together these say the improvement in the experiment group is both statistically significant and practically meaningful.
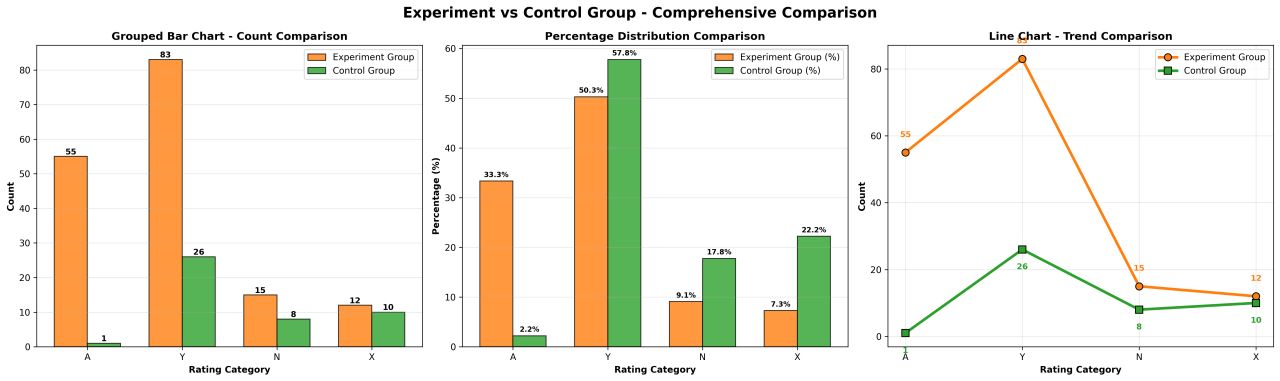
Interestingly, the control group had more plain “Yes” responses. Two possible explanations:
- Bias toward neutral responses. Users in the control group may have leaned toward “Yes” as a safe, middle-ground answer.
- Polarisation in the experiment group. Tailored suggestions might have prompted stronger opinions: more “Absolutely” and “Not at all”, fewer “Yes”.
These are theoretical interpretations and would need further analysis to confirm.
Why it matters
This analysis gave us clear, data-backed evidence that eRuchi’s matching engine delivers real value to users by helping them discover what genuinely aligns with their interests.